# Author: Crista Moreno
# Date: October 30, 2016
# ----------------------------------------------------------------------------#
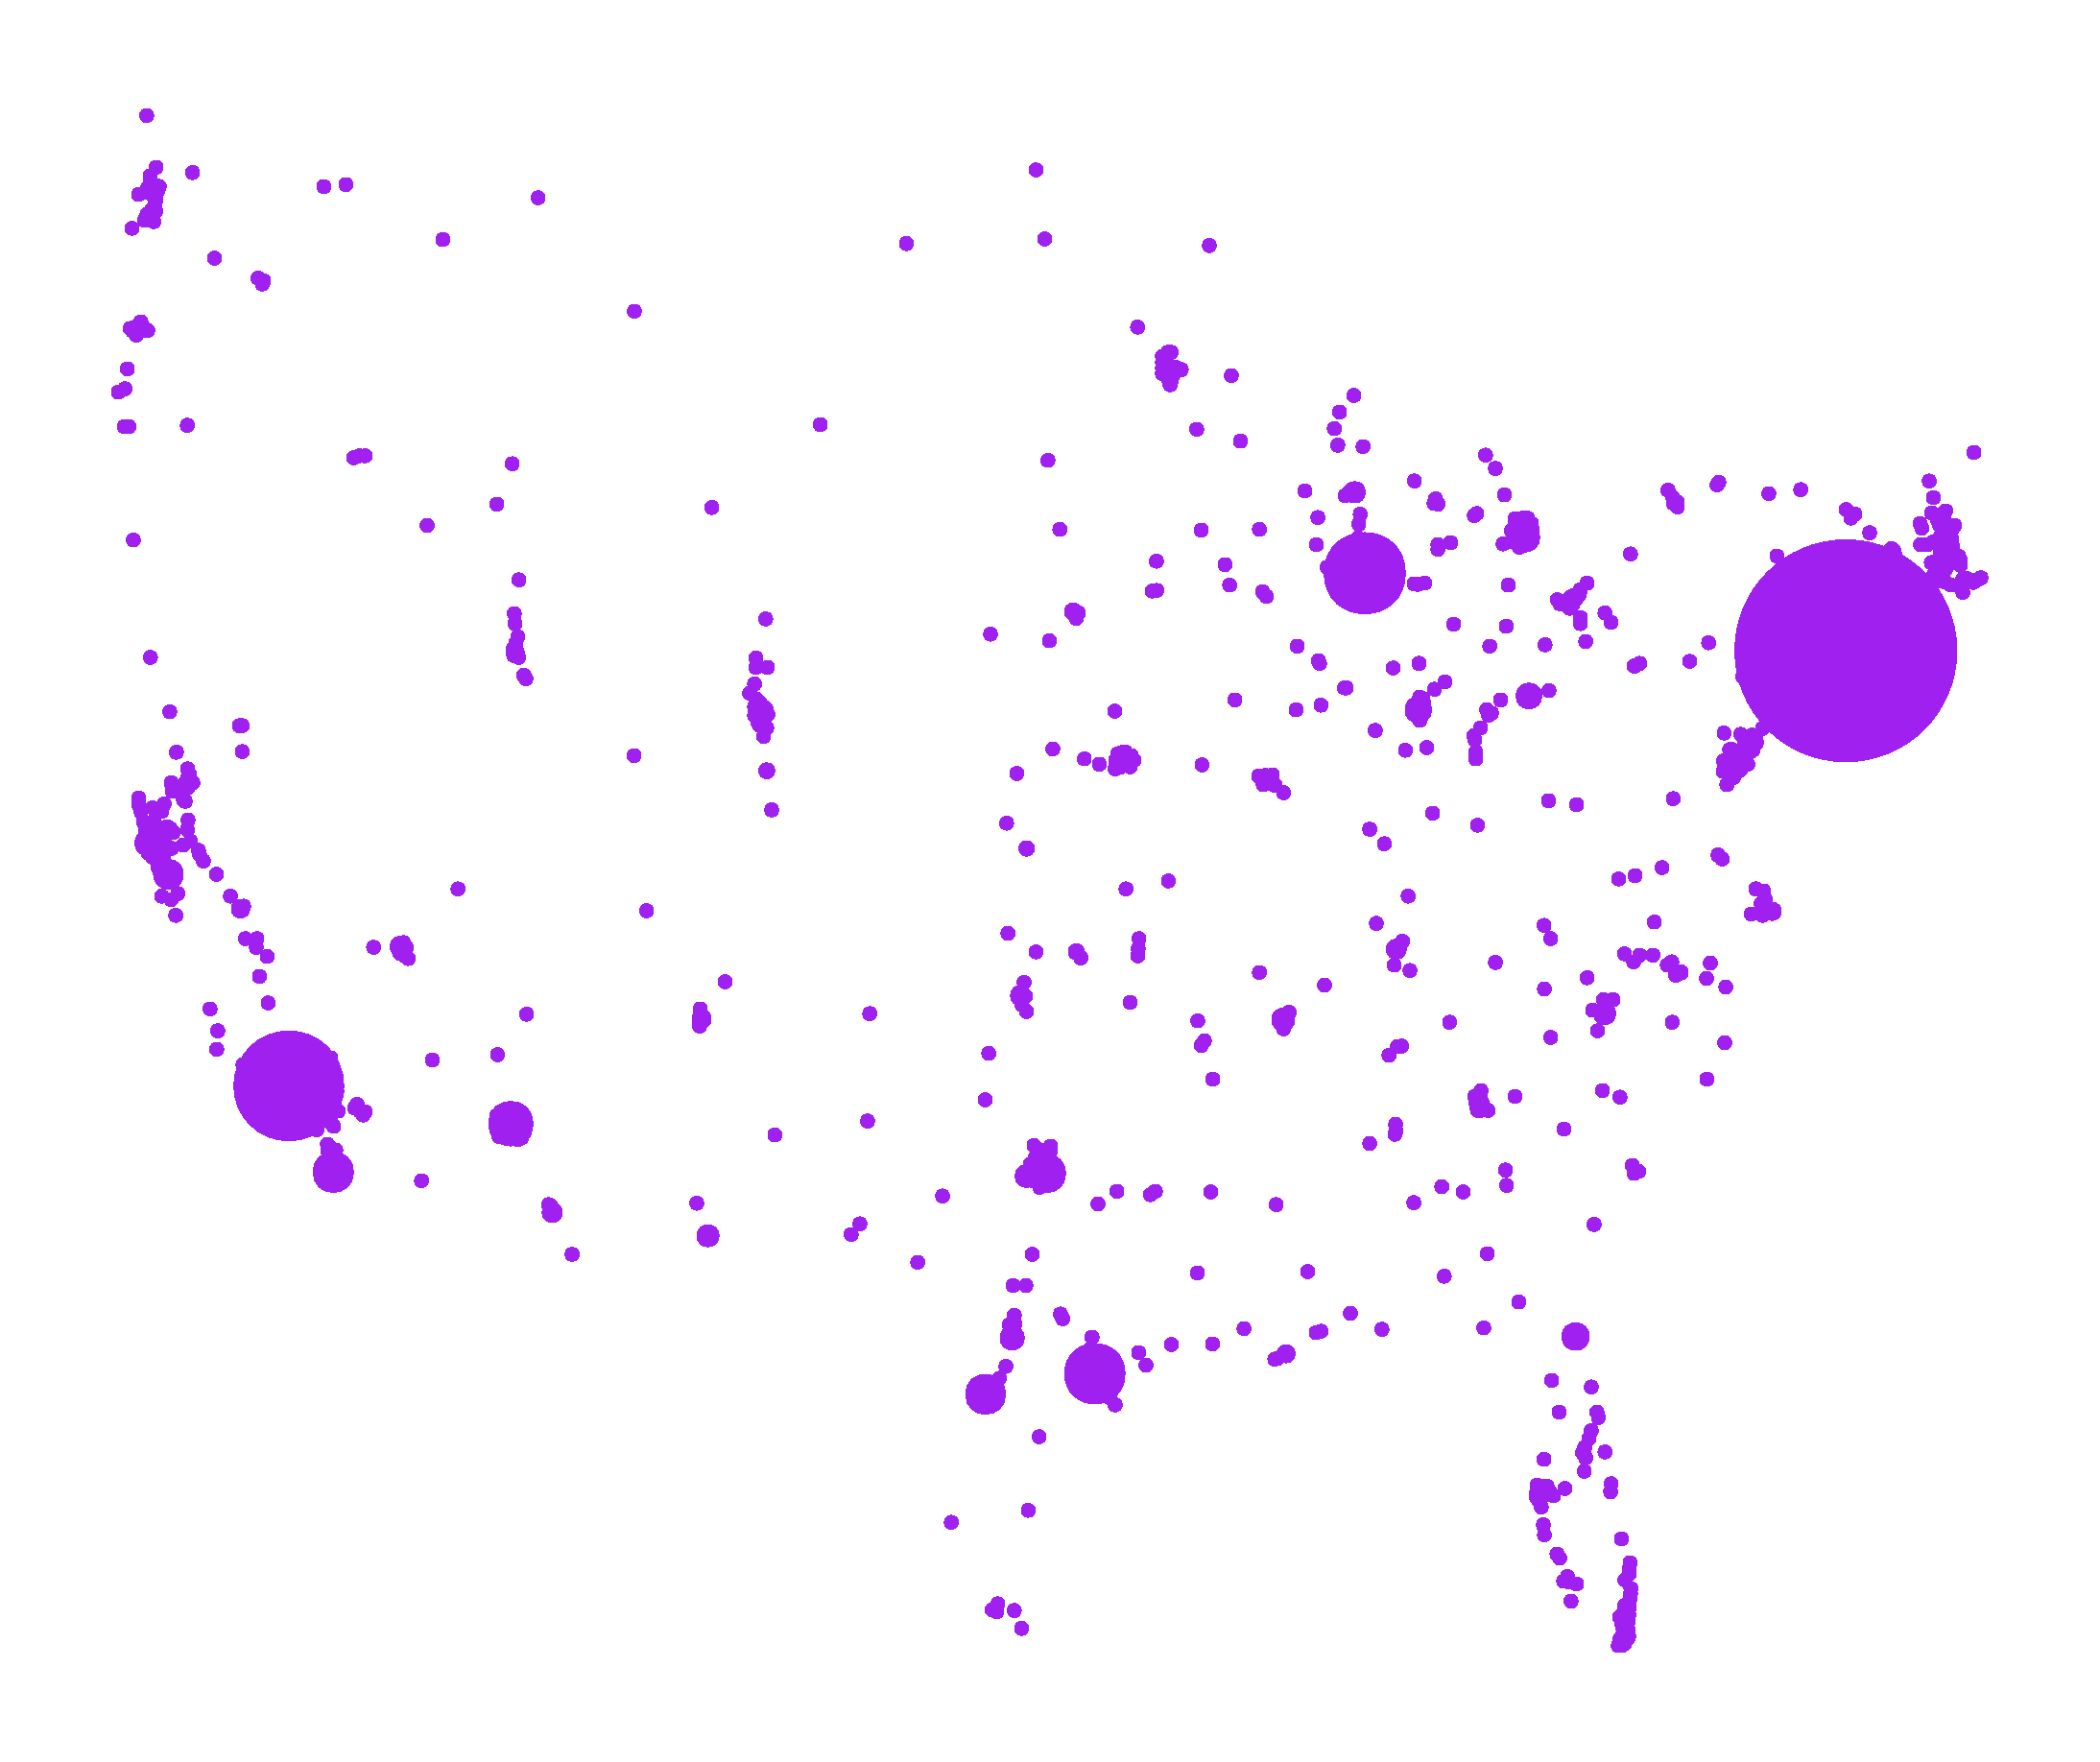
# Plots the world cities with points the size relative to the city's population.
# Cities with populations less than 1/80 the largest population size are removed.
# ----------------------------------------------------------------------------#
#svg(filename="sub_world_cities.svg")
library(maps)
data("world.cities")
# largest city population
max_city_pop <- max(world.cities["pop"])
# threshold for city population
threshold <- 1/80
# subset of world.cities dataframe that meets city population threshold
sub_world_cities <- subset(world.cities, world.cities$pop > threshold * max_city_pop)
# point size
#scale <- 4
scale <- 6
point_type <- 19
scaled_city_pop <- (sub_world_cities$pop/max_city_pop)*scale
#plot(sub_world_cities$long, sub_world_cities$lat, pch=point_type, cex=scaled_city_pop, axes=FALSE,
#xlab="", ylab="", col='violet')
plot(sub_world_cities$long, sub_world_cities$lat, pch=point_type, cex=scaled_city_pop, axes=FALSE, xlab="",
ylab="", col=rgb(1 - signif(scaled_city_pop,1)/200,signif(scaled_city_pop,1)/60, 1 -signif(scaled_city_pop,1)/6.5))
#dev.off()